![Zeck-blocks-100-3.png]](https://help.zeck.app/hs-fs/hubfs/Zeck-blocks-100-3.png?height=50&name=Zeck-blocks-100-3.png)
Included in this article:
1. How to add a KPI
Adding a Key Performance Indicator, or KPI, to a section is simple:
-
Open your Zeck in Editor mode.
-
Navigate to the section where you want to add the KPI.
-
Hover over a line and click the + icon to the left.
-
Select KPIs from the content menu.
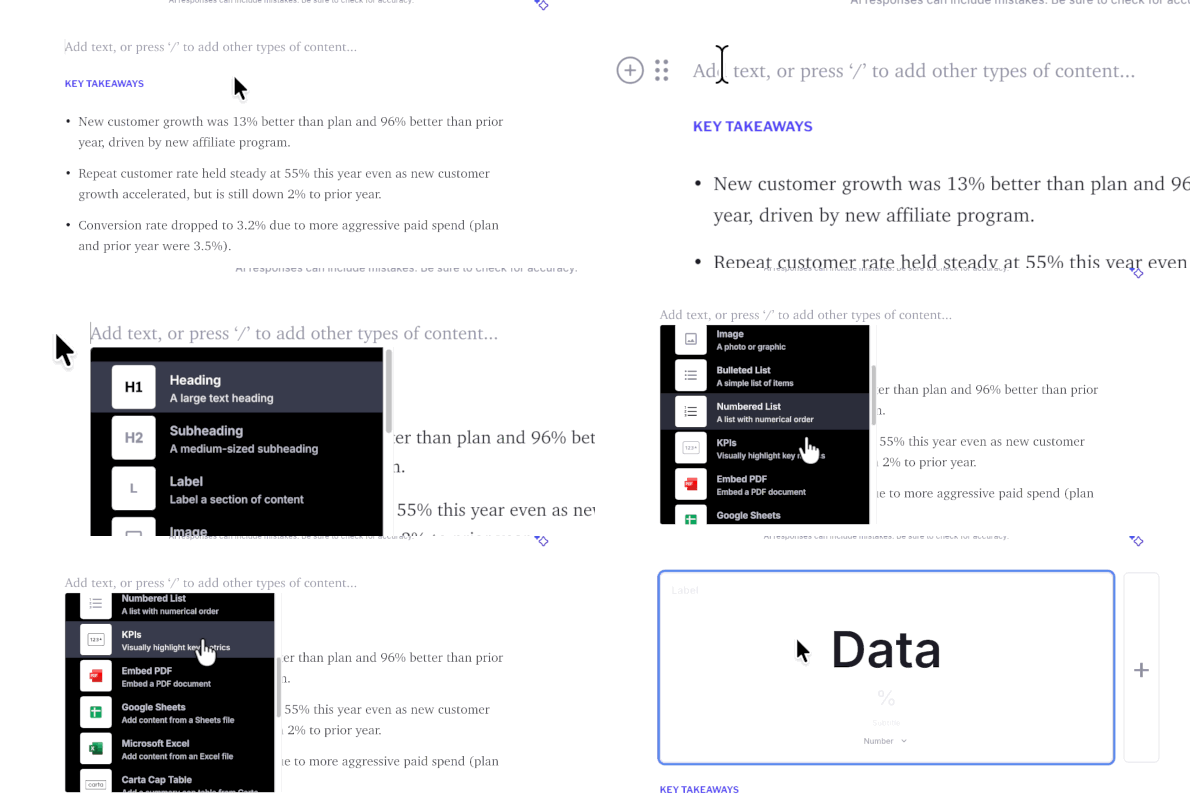
A KPI block will be added to your section with fields you can customize.
2. Customize your KPI
Click into each field to add the information you want to highlight. The fields are flexible, so you can use them however makes the most sense for your metric.
-
Label: The name or description of the metric, such as Revenue or Customer Churn.
-
Data: The primary value you want to highlight, such as $4.2M or 1,250.
-
Percentage: A percentage related to the metric, such as +18% growth.
-
Subtitle: Additional context for the metric, such as vs. Q2 or YTD.
-
Format: Choose whether the data should display as a Number, Dollar amount, or Percentage.
For example:
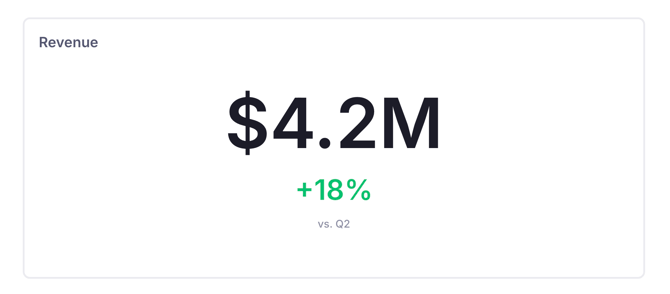
These are just examples. You don’t need to use every field, and the fields can be used in different ways depending on the metric you’re presenting.
Customize KPI colors
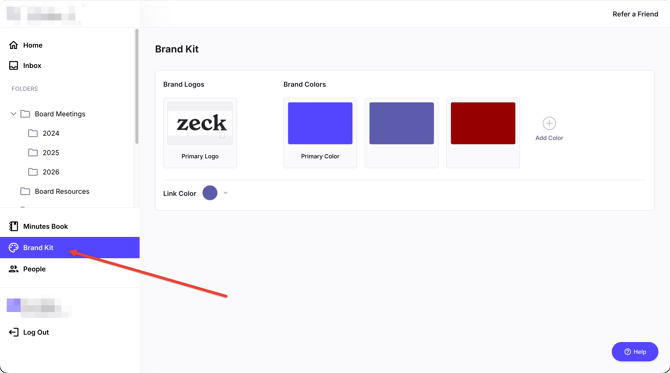
You can change the color of the text in the Data and Percentage fields using the brand colors configured in your organization’s Brand Kit.
-
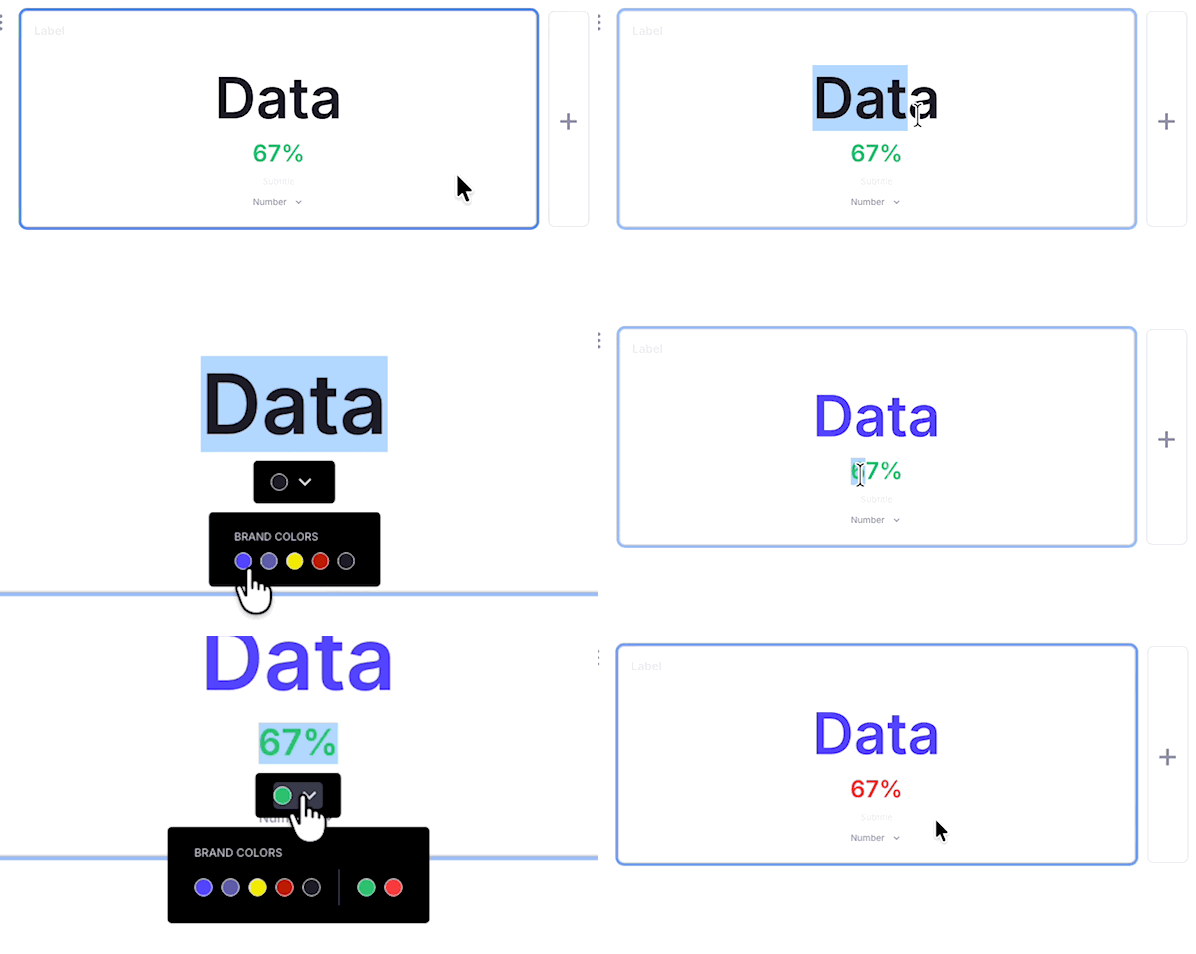
Highlight the text in the Data or Percentage field that you want to change.
-
Once the text is highlighted, the text formatting options will appear.
-
Select the text color option.
-
Choose a color from your organization’s Brand Kit.
- Percentage will have a green and red option included by default.
Only the highlighted text will be updated, so you can use different colors within the same KPI when helpful.
3. Add multiple KPIs
You can add up to three KPIs in the same row.
After adding your first KPI, click the + on the right side of the block to add another. Repeat the process to add a third KPI.
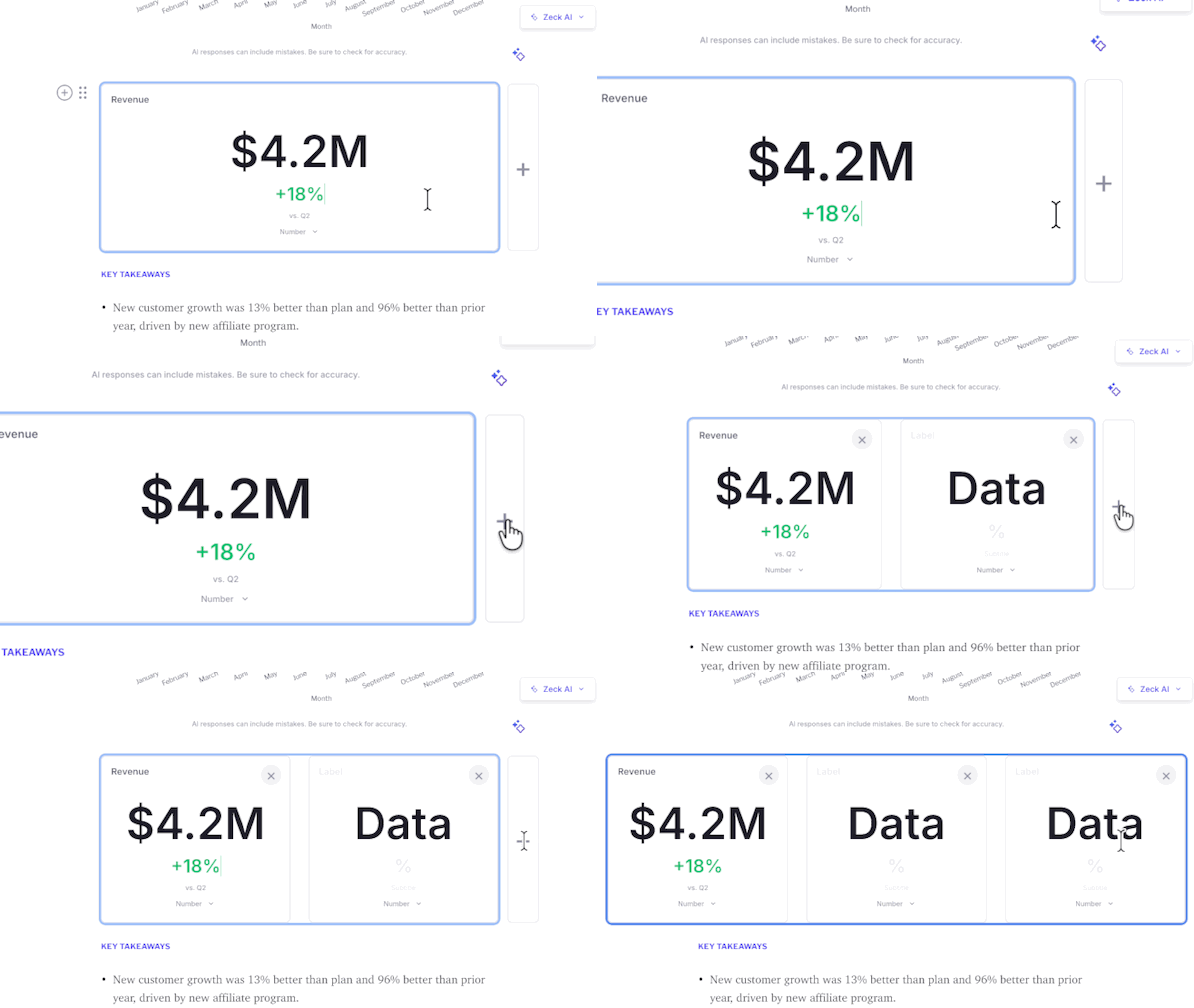
Grouping related metrics together can give board members a quick snapshot of an area of the business.
For example:
| Revenue | Gross Margin | Cash Balance |
4. When to use KPIs
KPIs are useful whenever you want important metrics to stand out within a board update.
Common examples include:
-
Financial performance: Revenue, ARR, EBITDA, gross margin, or cash balance
-
Growth and customers: Customer growth, retention, churn, or bookings
-
Operational performance: Key metrics tied to company goals or business operations
-
Period-over-period updates: Highlight a current metric alongside its percentage change or additional context
KPIs work especially well near the beginning of a section when you want to give the board the key numbers before providing additional detail or analysis.
💡 Tips for using KPIs
-
Keep it focused. Use KPIs for the metrics that are most important to the discussion.
-
Add context when helpful. A subtitle can clarify the period, comparison, or other information needed to understand the metric.
-
Group related metrics. When using multiple KPIs in one row, choose metrics that help tell the same story.
-
Use your Brand Kit. Customize Data and Percentage colors to keep your KPIs consistent with your organization’s branding.
👋 Need more help?Reach the Zeck Customer Success Team directly at success@zeck.app.